
Oil price for 2016 – where next?
CommentEconomic supercycle theories suggest that market economies run in cycles of a few decades. Commodity prices are driven upwards during periods of rapid growth as increasing demand hits supply constraints. A price collapse follows as slowing growth meets expanding supply.
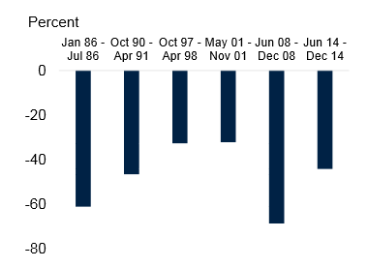
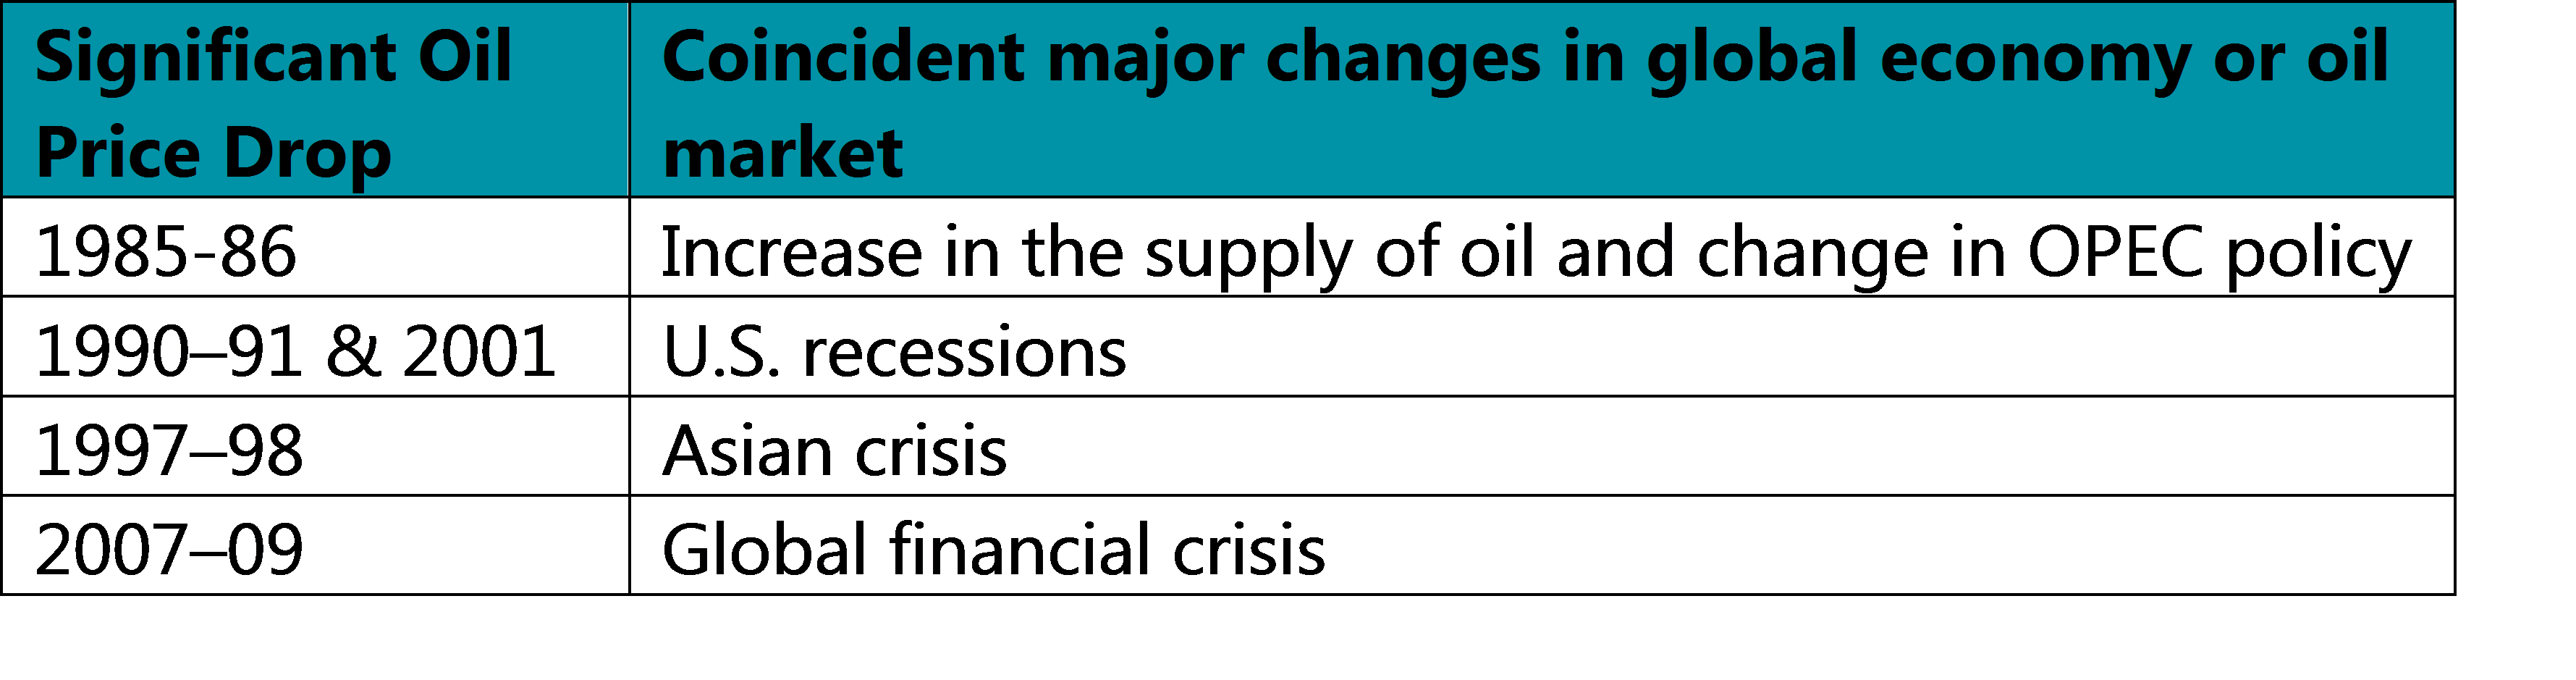
Whether or not you believe that there is such an underlying pattern to market behaviour, the collapse in oil prices in 2Q 2014 is not without precedent:
Magnitude of significant oil price drops 1985 to 2015
It’s easy to understand the reasons for the precipitous drop in oil price over the past 18 months or so:
- Supply & demand trends: greater than anticipated supply as shale oil production in the United States boomed (made profitable by high oil prices), lower than anticipated demand (although demand still remains strong)
- Changes in OPEC objectives: Saudi Arabia, traditionally OPEC’s swing producer, increased supply to defend market share rather than targeting an oil price.
Essentially this is a price war. There is a supply glut, and it’s probably only going to get worse in the short term following the lifting of sanctions on Iran.
Last week Goldman Sachs released an updated analysis. There is good news, and there is bad news.
The Good News
Oil prices will rise as supply and demand find a new balance.
The slump in oil price isn’t like a typical resources price slump. Resource prices usually decline because demand declines. This isn’t what is happening now.
No significant drop in oil demand through 2014 to early 2016
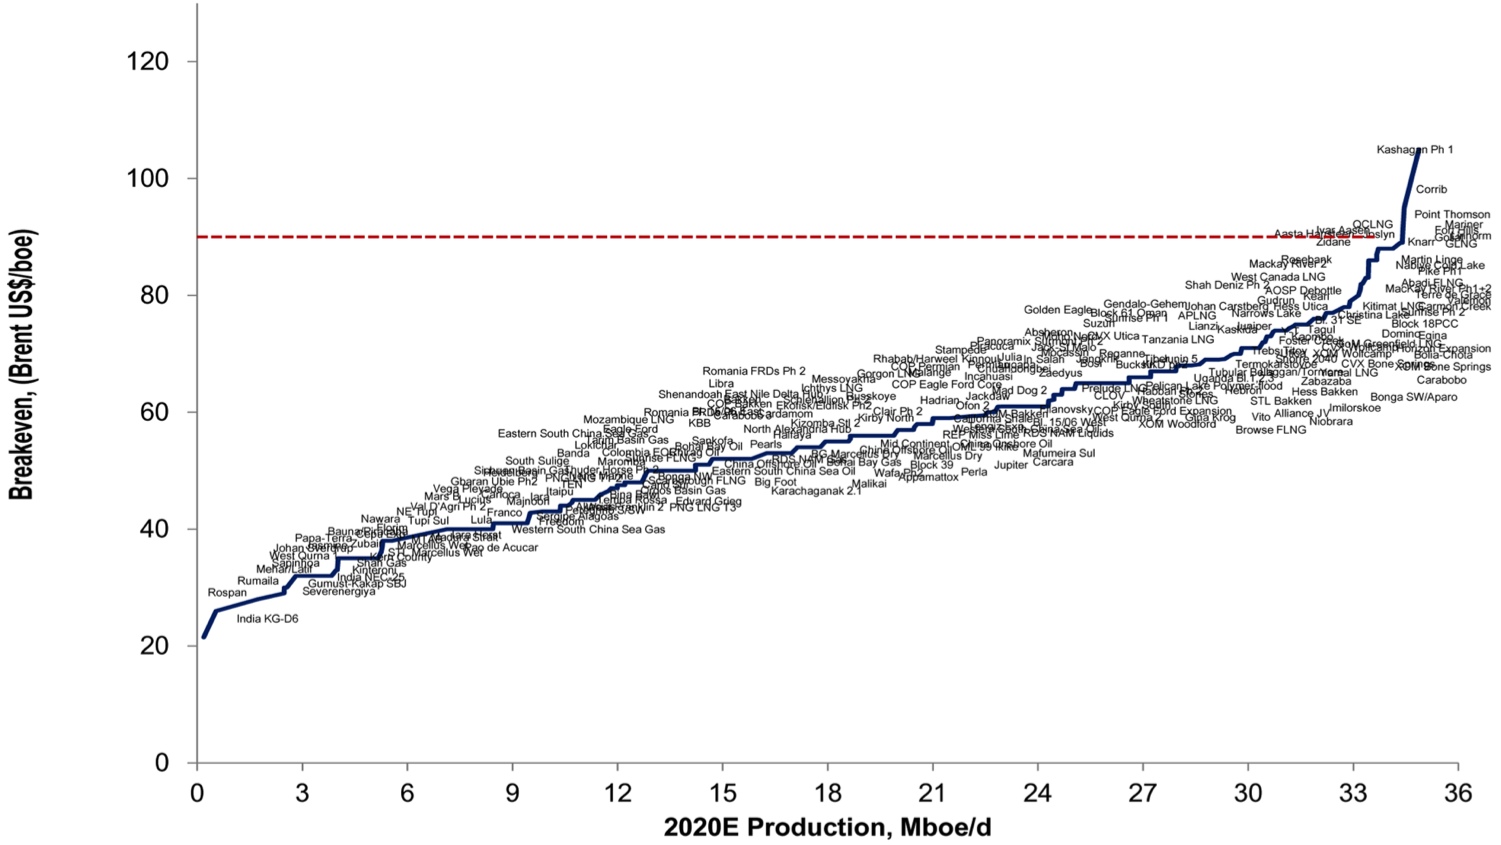
Back in November 2014 Citigroup’s Global Head of Commodities Research Ed Morse highlighted this chart listing the breakeven price for every international oil company project through to 2020. According to this, oil prices below $90/bbl clearly start to impact project viability, which will start to impact supply.
The Bad News
The oil price may go lower in the short term as supply starts to exceed storage capacity.
People are currently buying oil above real demand because they are storing it. But storage eventually reaches capacity, which seems to be where we are now.
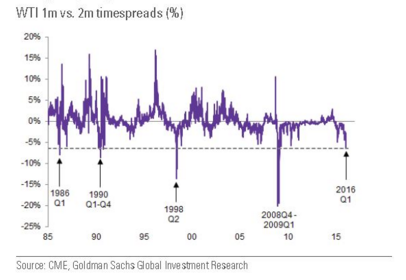
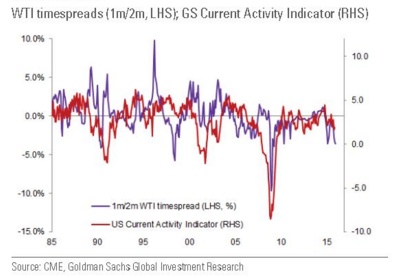
A difference between current and forward price is historically a tell-tale sign that storage is at capacity.
Where next?
The general consensus is that oil prices will continue to fluctuate between US$20/bbl and US$40/bbl for the first half of 2016. This will be a transformational year for oil, with supply and demand rebalancing over the next 12 months to reach a new equilibrium.
Surviving and thriving in this new environment will require companies to have a more agile mindset, and leaner execution models.